

As of late 2025, U.S. household debt hit $18.59 trillion. That isn’t just a number; it’s a red flag on the financial health of Americans.
The Squeeze
Student Loans: Borrowers are crushed under $1.8 trillion in total debt.
Auto Loans: We now owe $1.66 trillion on our cars.
Credit Cards: Balances have swelled to $1.23 trillion. This isn’t luxury spending; for many, it’s the only way to cover the gap between wages and the cost of living.
The “Squeeze”: Perhaps most damning, 63% of workers cannot cover a $500 unexpected expense.
Happiness: U.S. youth now rank 62nd globally in happiness.
Introducing the FinMango Barometer
Economic data suffers from a critical flaw: Latency. By the time official reports on poverty or inflation hit the headlines, the data is months old. We are navigating a hurricane using a weather report from last Tuesday.
That’s why we built the FinMango Financial Health Barometer. Powered by the Google Health Trends API, it transforms anonymized search data into a live monitor of the nation’s financial wellbeing, updating daily at midnight New York time.
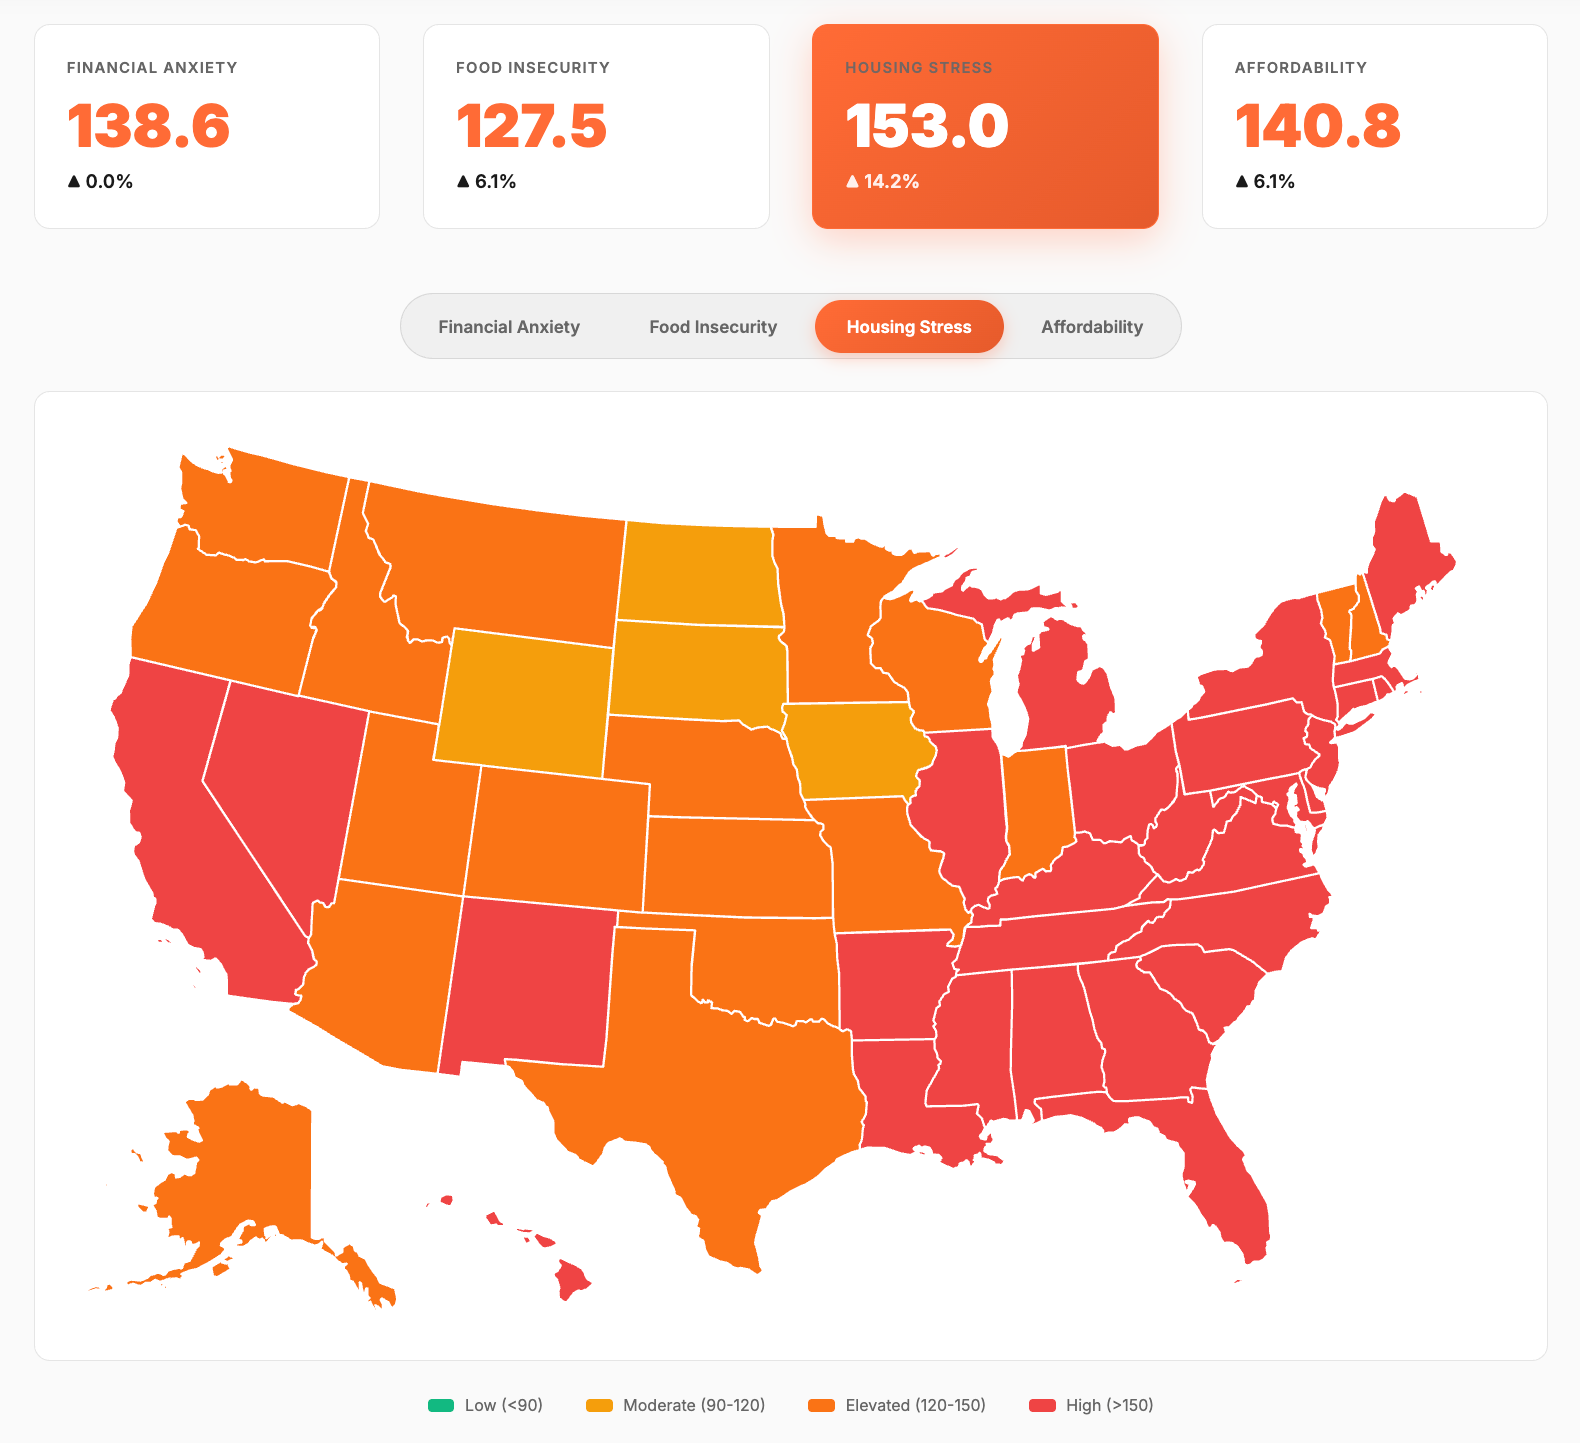
We don’t wait for survey results. We look at what people are actively searching for in their moments of greatest need.
How It Works: The Hybrid Model
We track four key indicators of systemic stress:
Financial Anxiety: Searches for debt relief and bankruptcy.
Food Insecurity: Real-time spikes in searches for food pantries and SNAP.
Housing Stress: Indicators of eviction concerns and rent help.
Affordability: The aggregate struggle to keep up with the cost of living.
To ensure accuracy, we use a Hybrid Calibration Model. We anchor our data in structural “truth” from the Census Bureau, HUD, and BLS as base layers and then layer real-time search volume on top. This allows us to detect potential acute shocks weeks before official statistics catch up.
The Bottom Line
Financial health is dynamic. Our tools should be too.
We built this because policymakers, nonprofits, and researchers need to identify “hot spots” of stress before they become headlines. We need to see where the cracks are forming in real-time.
👉 Launch the Barometer
👉 Read the Technical Whitepaper on GitHub